Click here
[Very special thanks to John Vonderlin for sending this to me. Email John: [email protected]
CALIFORNIA SEA FLOOR SURVEY
SHEDS NEW LIGHT ON BIG WAVES
New Sonar Data Helps Explain Why ‘Mavericks’ Waves
are Among Nation’s Largest
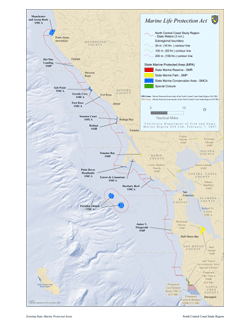
 This map (click image for larger view) shows the geographic range of the north-central coast study region for the current phase of the Marine Life Protection Act implementation process. Seafloor mapping data is being collected throughout this entire area to provide habitat distribution information.
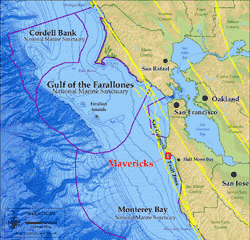
 This is a regional map (click image for larger view) showing National Marine Sanctuary boundaries, Bay Area faults, and the location of the data collected at Mavericks.
Over the last decade, the Mavericks surf break has captured international attention. An interesting question is, “Why do such big waves break here?”
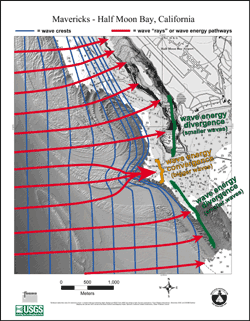
 This is a map of shaded bathymetry with wave lines on it. The blue lines show hypothetical large wave crests propagating in to shore from the west. As the waves move into shallow water, they begin to interact with the seafloor (“shoal”) and their crests slowly bend to try to maintain their roughly parallel orientation to the bottom contours. The more the waves interact with the seafloor, the more they slow down and bunch up. Wave “rays”, or the pathways of wave energy, move perpendicular to the wave crests. In areas where the wave rays, and hence wave energy, diverges, the wave height decreases. Conversely, in areas where the wave rays, and hence wave energy, converges, the wave height increases. Due to the steep topography of the bedrock reef at Mavericks, the wave energy rapidly converges and the wave height rapidly increases, creating a huge wave compared to the adjacent areas.
The dominant wave direction off the central coast of California during most of the year is from the northwest. These waves propagate over the much gentler topography to the northwest of Sail Rock and are generally too small to shoal and break at Mavericks. Sometimes during the winter months, however, strong North Pacific storms generate large, long-period waves from more westerly directions that shoal and break over the bedrock reef just to the east of Sail Rock. The abrupt topography of the bedrock reef causes wave energy to converge over the reef, causing the wave to rapidly slow down, shorten in length and substantially increase in height relative to the areas just to the north and south of the east-west trending reef. This interaction of the geology and oceanography is what makes the wave at Mavericks so spectacular compared to many other locations along central California.
Mavericks flythrough animation (mpg, 10 MB)
This fly-through begins approximately ½ mile offshore from Pillar Point north of Half Moon Bay. The area we are looking at in detail is a shallow nearshore reef in the vicinity of the San Gregorio fault, a major active fault within the San Andreas fault system. Motion on the fault zone has uplifted and deformed the rocks in the area near Mavericks into the S and J shaped folds we see on the seafloor.
The 3-D image is color-coded by depth: the blue and green areas are deeper than the areas in yellow and red. You can see how rugged the sea floor is in this area with lots of ridges, valleys, chasms, and pinnacles.
The new data indicates that Mavericks is above a portion of the rocky reef that is shallower than the surrounding rock. As a wave front approaches the shoreline and progressively enters shallow water, it becomes compressed and grows taller. The ridge promontory also has the effect of focusing wave energy and the wave height rapidly increases, creating a huge wave compared to adjacent areas. About here (the highest red we see), the wave becomes unstable and breaks. In fact, the data collection stopped here because the rough sea conditions made it too dangerous for the scientists to operate their boat!
Although interesting for explaining the mystery of Mavericks, scientists and resource managers will be using this data to identify hazards to navigation, classify different habitat types, locate biological hot spots, and study the San Gregorio fault.
